Over the hill!
The Cooperative Lakes Monitoring Program (CLMP) has been operating since 1974 (when it was called the “Self-Help Program”). Every summer since then, with the exception of 1992 when the program was undergoing some administrative changes, volunteers have been measuring and monitoring lakes across Michigan. That means last summer we hit the big 4-0!
How has the program grown?
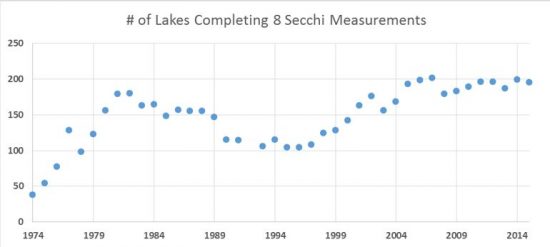
There are different ways to look at how the program has changed over the years. The most basic way is to see how many lakes are enrolled in the Secchi Disk Transparency parameter every year. This parameter is our most basic test of water quality and every lake in the CLMP must register for it. Making at least eight measurements over the course of the summer is considered successfully completing the monitoring. The graph below shows the number of lakes successfully monitoring Secchi over time; numbers increased rapidly initially, dropped off in the 1990s when funding of the program was very limited, picked back up in the early 2000s, and leveled off from about 2005 to the present.
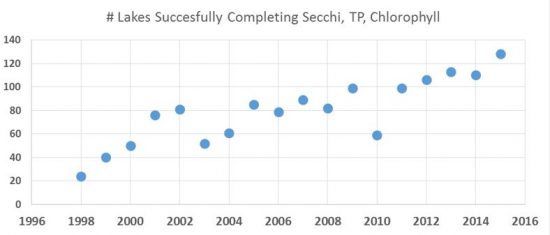
However, contrary to what the graph shows above, the program has not been stagnant over the last 10 years. Phosphorus and chlorophyll-a monitoring has become increasingly popular since these parameters were developed in the late 1990s. The program also began to purchase dissolved oxygen meters and loan them out to volunteers. In the last 10 years, the CLMP started to offer plant mapping and exotic plant detection, and beginning in 2016, now offers a lakeshore habitat assessment: the “Score the Shore” parameter. The graph below shows the number of lakes that have successfully completed Secchi disk, summer total phosphorus, and chlorophyll-a. The numbers have gone up and up. Last summer was our most successful season yet, and actually the registration numbers for 2016 show that this summer will be even better.
A quick note about the Trophic Status Index (TSI)
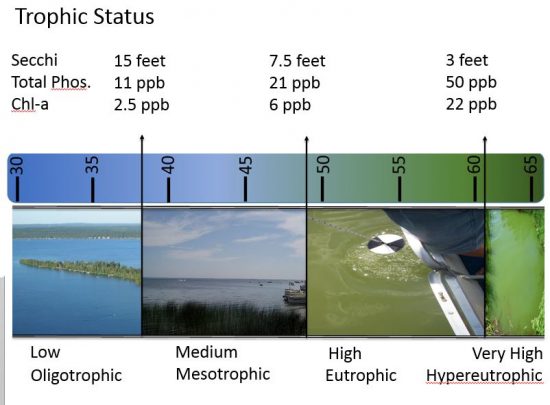
The trophic status of a lake is a classification of that lake into one of three categories: oligotrophic, mesotrophic, and eutrophic. An oligotrophic lake is clear and low in nutrients, and on the other end of the spectrum is an eutrophic lake that is cloudy due to algae growth and high in nutrients. (Hypereutrophic is a specialized subcategory of an eutrophic lake that indicates extremely high nutrient levels.)
The three monitoring parameters of Secchi transparency, summer total phosphorus, and chlorophyll-a are used to classify a lake into one of these categories. In a nutshell, the results from these monitoring parameters give a lake the TSI score that puts it on the spectrum below. For example, a lake with a Secchi transparency of 10 feet, total phosphorus of 15 ppb, and chlorophyll-a of 4 ppb would score approximately a 44 on the TSI scale and be classified as a mesotrophic lake.
How has the trophic status in CLMP lakes changed over time?
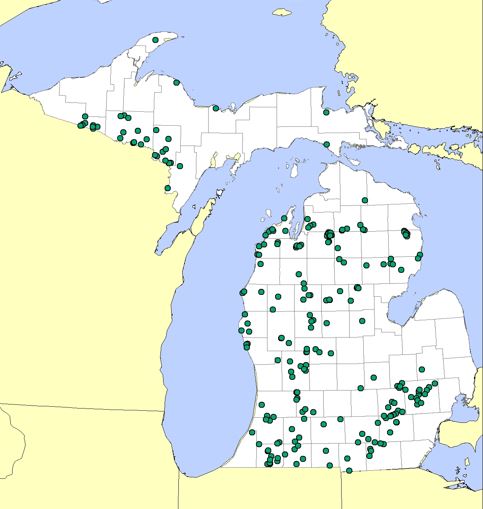
First off, before diving into this difficult topic, there are a couple of things to clarify. Lake residents (or lake associations) self-register into the program, and they also take themselves out of the program at their own choosing. This means that CLMP lakes are not a random representation of all Michigan lakes and that the roster of lakes is constantly changing. They also tend to be medium or large sized lakes, with many homes around them, not small lakes or pristine lakes hidden in the back county. This is just something to keep in mind as we look at trends since 1974 and not over-reach in the ramifications of what we see.
Secchi
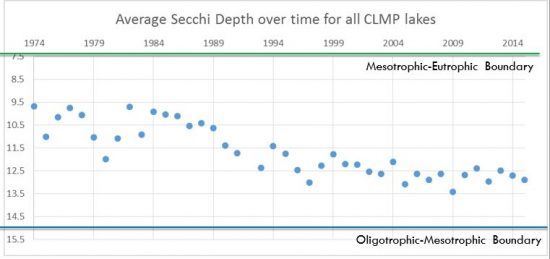
The graph below shows how on average CLMP lake transparency has changed over the last forty years. There is a small but noticeable change over time, from about 10 feet of transparency to 12.5. Based on Secchi disk transparency, the average lake was mesotrophic in 1974 and is still mesotrophic in 2015, although perhaps leaning more toward the oligotrophic category than eutrophic. Certainly there is a lot of variability when looking at individual lakes, as some have stayed the same and some have gotten significantly more clear. Only a handful of lakes in the program have actually lost transparency over the years. Factors that would contribute to a lake becoming more clear over time are improvements in management from installation of sewer systems instead of reliance on septic systems, and a reduction of phosphorus fertilizers. Zebra mussel infestations have also increased transparency.
Summer Total Phosphorus and Chlorophyll-a
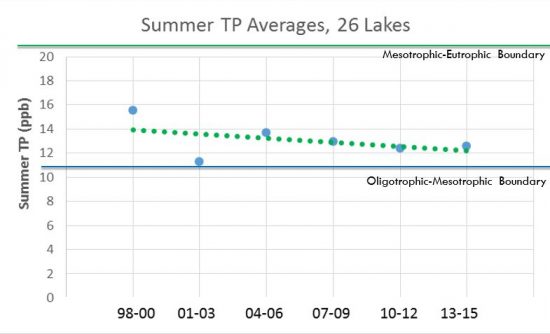
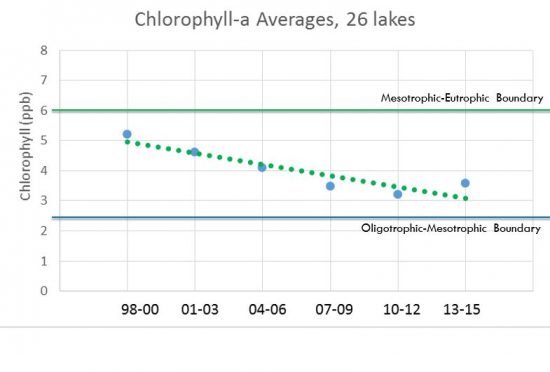
These two parameters have been monitored since the late 1990s. To get a more accurate look at how these parameters have changed over time, we pulled out the 26 lakes in the program that have consistently measured them from 1998-2015 and built the graphs below on those lakes only. The results are quite interesting. Like transparency, at the earlier years of monitoring the lakes were mesotrophic but closer to the eutrophic side of the TSI spectrum. Over the last 17 years, there has been a consistent trend to lower phosphorus and lower chlorophyll levels. The average lake in the CLMP is now very close to the oligotrophic/mesotrophic boundary. This trend is especially clear in the chlorophyll graph.
In summary, the Secchi transparency, summer total phosphorus, and chlorophyll-a results indicate that on average, nutrient levels are decreasing in lakes that are enrolled in the CLMP.
Wrapping it up
The CLMP has seen great growth in what it can do and in the number of lakes and people involved since 1974. And since the data point to nutrient levels going down in the average CLMP lake, there is an argument to be made here that the work the CLMP volunteers are doing on a local level and the work that water resource professionals are doing on a statewide level in teaching lake residents and lake boards about lake and water quality is really making a positive difference.
Good job, folks! Let’s keep the monitoring, teaching, and wise lake management going!